4 TYPES OF RETURNS YOU NEED TO KNOW IN APARTMENT INVESTING

Multifamily investments are known to be one of the most attractive investments in the marketplace today because of its stability given the basic need it serves – everyone needs a place to live.

As an investor, you can’t just look at one return metric for investing, and multifamily investing is no exception. You need to know at a minimum annualized returns, cash on cash returns, internal rate of return, and the equity multiple. These 4 basic metrics will help gauge performance and will allow you to make a decision about the offering. Let’s dig into these terms!

Average Annualized Returns (AAR)

The first measure of an investment is average annualized returns. Add up your total earnings over the life of the investment (both cashflow AND profit from the sale) and divide that by the amount invested. Then divide THAT by the number of years, or holding period, your money was kept in the deal. The result is the average of the annualized returns of the investment, also known as the average annualized returns. See the attached formula to calculate AAR:

Cash on Cash Return (CoC)

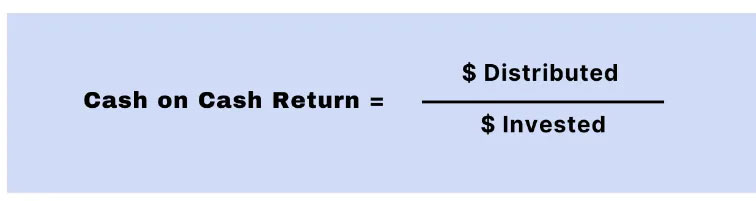
Cash on Cash Return is the measure of how much cash you receive annually based on your initial investment. CoC is really a measure of your return ON capital. An investment with a cash on cash return of 20% (1 / 5)  means it will take 5 years to recoup your initial investment.

Formula to determine CoC is below:

Internal Rate of Return (IRR)

IRR is a calculation of how much your money is growing annually and incorporates all cash distributions including proceeds from the sale or a refinance. It takes into account the time value of money and how much it is worth today versus its worth in the future. A given return on investment received at a given time is worth more than the same return received at a later time, so the latter would yield a lower IRR than the former(all things equal). 

IRR is the “annualized effective compounded return rate”. The textbook definition is the interest rate, or discount rate, when the Net Present Value (NPV) of all cash flows equal to zero. Although IRR gives you the most accurate way to compare investments it also happens to be the most complex of them all. It is a calculation of the annual rate of growth an investment is expected to generate. 

Rather than putting formulas in this article where you are solving for exponents in series, I recommend just using a spreadsheet application like Excel, Google Sheets, etc.

Equity Multiple

Lastly, we have the Equity Multiple. It is pretty straightforward, it just simply shows how much your money has increased that you have invested. It is easy to understand because the investor sees how many folds will their investment increase. The downside to this is it doesn’t reflect the holding period of time-value of money. The formula for calculating this is below, and it’s worth noting the ‘Total Cash Distributions’ include cash flow distributions AND profit at same.

In Closing

Each return metric has its limitations of usefulness, which is why you can’t look at JUST one return metric. Looking at just one return metric could cause the investor to overlook a critical detail. An investor should be considering a number of return metrics for each offering. The risk profile of the investment’s business plan should be considered. It is important to note that the returns change based on your investment strategy. Generally speaking, you’d expect something with higher risks to yield higher returns. For an idea of investment strategies, check out our article HERE. 

If you want to learn more about multifamily investing, check out www.tbcapitalgroup.com

Leave a Reply

Your email address will not be published. Required fields are marked *